OK, next step in ShowSlow was to make measured data to be a little bit more useful for analysis – previous change of adding rule grades was useful, but simply replicates YSlows functionality and you should be using YSlow itself to get this data.
This time I’ve added something that almost no analytics systems have for some reason – custom events reported directly on the main graph (originally this idea came from building of custom web analytics software).
So, how does this work? First , you can report any event that happened to the site during some time frame (or at specific moment). To do so you can use a beacon located under /beacons/events/ in you installation – see it in action here: http://www.showslow.com/beacon/events/
You can use a simple web form to add data or you can write an automated script that will send events there automatically.
When submitting events, make sure you specify URL prefix to have your events being reported only for sites that these events actually affect (I assume that you’ll be running it locally for just a few sites and not whole internet). In addition to event title, you can also add resource URL that will link to the page related to the event (e.g. blog post, updated file in your Subversion repository or Bugzilla page that describes fixed bug).
You can also add “type” field to distinguish between the events (e.g. “blog post”, “svn” or “bug”) – hope to have those colored differently in the future.
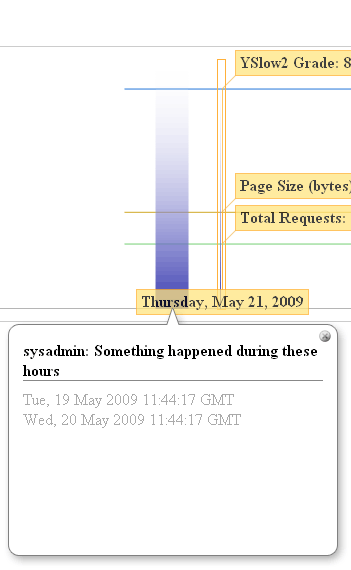
So, when after you have events in your system, they will be displayed on a timeplot chart as vertical lines or areas (if it was a continuous event where you specified end date/time). When you hover over the event, it gets orange border and when you click on it, note bubble pops up with event title (and link if it was provided):
So feel free to automate the event gathering process – looks like I’m going to set up CSS/JS changes to be reported there as first thing on my internal instance.
